Modifying Tables
For any table in a report, you can further modify it at any time. For example, you can insert more columns and rows in the table, summarize data in the detail columns of the table, and format cells of the table. This topic introduces how you can modify the tables in a report.
This topic contains the following sections:
- Editing a Table with Wizard
- Sorting Detail Data in a Table
- Inserting Columns/Rows in a Table
- Converting Table Columns
- Aggregating on Detail Columns in a Table
- Showing/Hiding Summaries in a Table
- Formatting Table Cells
- Resizing Table Columns/Rows
- Showing, Hiding, and Deleting Table Columns/Rows
![]() Some table operations require to use the shortcut menu on table cells, however when a table cell is entirely occupied by another object, it would be difficult to access its shortcut menu. In this case, you can resize the object in the cell first, then in the Report Inspector, select the node representing the cell that holds the object to select the cell itself. After that, you can right-click on the blank area in the cell to get the shortcut menu.
Some table operations require to use the shortcut menu on table cells, however when a table cell is entirely occupied by another object, it would be difficult to access its shortcut menu. In this case, you can resize the object in the cell first, then in the Report Inspector, select the node representing the cell that holds the object to select the cell itself. After that, you can right-click on the blank area in the cell to get the shortcut menu.
Editing a Table with Wizard
You can further modify a table by accessing its shortcut menu wizard which contains a set of screens that are similar to the wizard screens that you use to create the table. For example, you can change the data the table applies, edit the groups in the table, and apply a new style to the table.
- Right-click the table and select Table Wizard from the shortcut menu to display the Table Wizard dialog box.
- In the Data screen, you can specify a new data source for the table.
- In the Display screen, specify the detail fields to display in the table. You can select an existing detail field and then select another field in the Resources box and select Replace
 to replace the detail field. Select Sort Fields By to specify how to sort the detail values.
 - In the Group screen, specify the criteria for grouping data in the table.
- In the Style screen, select the style you want to apply to the table.
- Select Finish to accept the changes.
For more information about defining a table, see Inserting Tables in a Report.
Sorting Detail Data in a Table
By default, the detail records in a table display randomly. They display in the order they are returned from the fetch operation. You can customize to sort the records in a table, and also within the groups in the table if any.
- When creating or editing a table with the table wizard, select Sort Fields By in the Display screen. Designer displays the Sort Fields By dialog box.
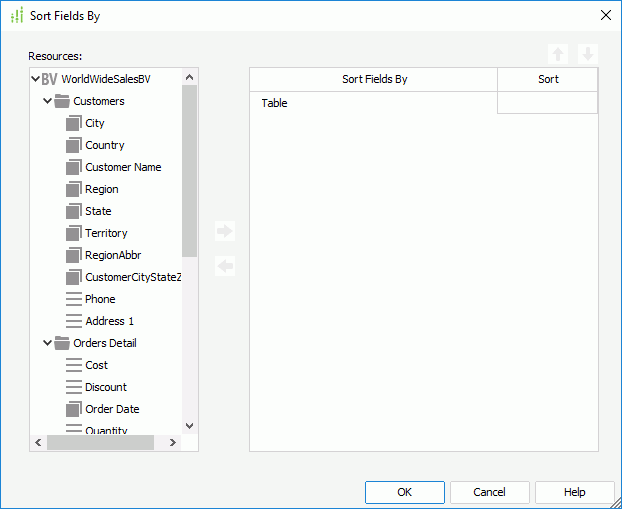
- In the Resources box, select a field as the sort-by field and select Add
 or drag the field from the Resources box to the right box.
- For a table using a business view, you can choose from the group objects
 and detail objects
  in the business view the table uses, and the dynamic formulas used as Group
  and dynamic formulas used as Detail
  that you have created for the business view in the current report.
 - For a table using a query resource in a page report, you can choose from the DBFields in the query resource, and the formulas and parameters valid to the DBFields in the current catalog. For the usage about parameters as sort-by fields, see Sorting Data Dynamically.
- For a table using a business view, you can choose from the group objects
- From the drop-down list in the Sort column, specify the order to sort values of the field: Ascend or Descend.
- Add more sort-by fields and specify the sort manner of each field using the same way.
- Adjust the order of the sort-by fields using Move Up
 and Move Down
  . The order determines the sort priority of the fields.
 - Select OKto accept the sort settings.
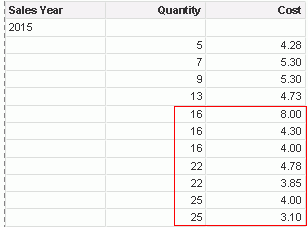
For example, if a table displays the detail fields for product quantity and cost and you want to sort the detail values first by quantity ascending and then cost descending. You can specify the sort manner as follows:

And the result is:
![]() You cannot sort the following SQL type of data: Db.SQL_BINARY, Db.SQL_BLOB, Db.SQL_CLOB, Db.SQL_LONGVARCHAR, Db.SQL_LONGVARBINARY, Db.SQL_VARBINARY, and Db.SQL_OTHER.
You cannot sort the following SQL type of data: Db.SQL_BINARY, Db.SQL_BLOB, Db.SQL_CLOB, Db.SQL_LONGVARCHAR, Db.SQL_LONGVARBINARY, Db.SQL_VARBINARY, and Db.SQL_OTHER.
Inserting Columns/Rows in a Table
Besides using the table wizard to create columns and rows in a table, you can also insert columns and rows directly using the Insert Column/Row feature. A table can contain the following types of columns: group columns, detail columns, summary columns, and common columns.
- Select the table or a column in the table, right-click it, then navigate to Insert > Group Column on the shortcut menu. Designer displays the Insert Group Column dialog box, which lists the existing groups the table contains in an indented structure in the right box. You can edit the groups if you want.
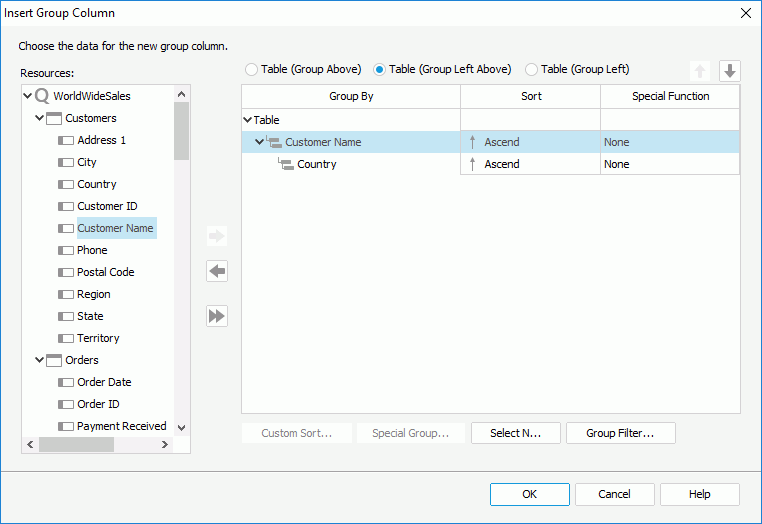
- In the right box, select the group level of the new group column by selecting Table or an existing group, then select a field in the Resources box as the group-by field and select Add
 or drag the field from the Resources box to the right box.
- For a table using a business view, you can select from the group objects in the business view, and the dynamic formulas used as Group that you have created for the business view in the current report.
- For a table using a query resource, you can select from the DBFields in the query resource, and the formulas and parameters valid to these DBFields in the current catalog. For the usage about parameters as group-by fields, see Grouping Data Dynamically.
- In the Sort column, set the sort manner of groups at this group level.
- Specify the position of the group-by field in the table:
- Table (Group Above)
Select to place the group-by field in its own row above the detail information. - Table (Group Left Above)
Select to place the group-by field in its own row and column above and left of the detail information. - Table (Group Left)
Select to place the group-by field in its own column left of the detail information.
- Table (Group Above)
- If the table uses a query resource, you can also specify the following:
- Select Select N to specify the Select N condition for the group level.
- Select Group Filter to specify the filter condition to filter groups at this group level.
- When the group-by field is Numeric, String, Date, or Time data type, select a special function for it from the Special Function drop-down list.
- Repeat the preceding steps to add more group columns. You can adjust the group levels by selecting a group column and selecting Move Up
 or Move Down
  .
. - Select OK to insert the group columns.
- Select the table or a column in the table, right-click it, then navigate to Insert > Detail Column on the shortcut menu. Designer displays the Insert Detail Column dialog box.
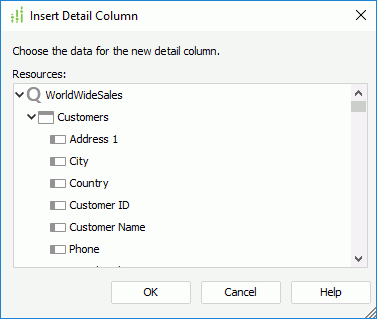
- Select the data field you want to use for the detail column.
- For a table using a business view, you can select from the group objects and detail objects in the business view, and the dynamic formulas used as Group or Detail that you have created for the business view in the current report.
- For a table using a query resource, you can select from the DBFields in the query resource, and the formulas and parameters that are valid to these DBFields in the current catalog.
- Select OK to insert a new detail column with the specified data field in the table.
Where Designer would place the column depends on the following: if you use the column shortcut menu to insert the column, Designer places the new column before the selected column; if you use the table shortcut menu to insert the column, it is after the last detail column, or as the last column in the table when there is no detail column.
- Select the table or a column in the table, right-click it, then navigate to Insert > Summary Column on the shortcut menu. Designer displays the Insert Summary Column dialog box.
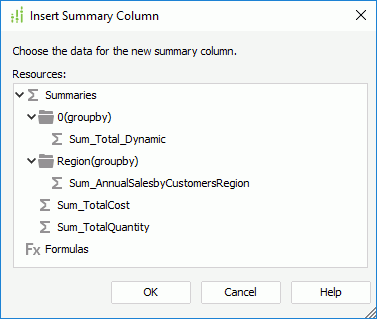
- Select the data field you want to use for the summary column.
- For a table using a business view, you can select from the aggregation objects in the business view, and the dynamic formulas used as Aggregation and dynamic aggregations that you have created for the business view in the current report.
- For a table using a query resource, you can select from the dynamic summaries in the current catalog that are valid to the DBFields in the query resource, and the static summaries without group-by fields or based on the same group-by fields as these in the table if the table contains groups. The formulas that are valid to the summaries are also available in the resource list.
- Select OK. Designer inserts a new summary column in the table which calculates data as follows:
- For a table using a business view, if it is a summary table in a web report or library component, the summary column calculates data based on the innermost group of the table and the whole table; otherwise, the summary column calculates data based on each group of the table and the whole table.
- For a table using a query resource, when the selected summary is a dynamic summary, the summary column calculates data based on each group of the table and the whole table; when the summary is a static summary with a group-by field, the summary column calculates data based on the same group in the table; for a static summary without a group-by field, the summary column calculated data based on the whole table.
Where Designer would place the new summary column in the table depends on the following: if you use the column shortcut menu to insert the column, Designer places the new column before the selected column; if you use the table shortcut menu to insert the column, it is after the last summary column, or as the last column in the table when there is no summary column.
- Select a cell in the table, right-click it and select Insert on the shortcut menu. In the Insert dialog box, specify where to insert the column, before or after the selected cell, then select OK. Designer then inserts a new common column into the table in the position you specify.
- Select a column in the table, right-click it, then on the shortcut menu, navigate to Insert > Common Column. Designer inserts a new common column before the selected column.
- Select the table, right-click it, then on the shortcut menu, navigate to Insert > Common Column. Designer inserts a new common column as the last column in the table.
You can then drag the required data fields from the Data panel or objects allowed for table cell from the Components panel into the column.
- Select a cell or a row in the table, right-click it and then select Insert on the shortcut menu.
- In the Insert dialog box, specify where to insert the row, above or below the selected cell.
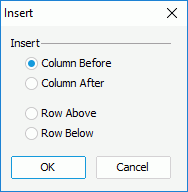
- Select OK. Designer then inserts a new row of the same type into the table according to the specified position. You can drag the required data fields from the Data panel or objects allowed for table cell from the Components panel into the row.
Converting Table Columns
You can convert the group columns into detail columns. For a detail column, when the field in it can be used as group-by field, you can also convert it to a group column.
To convert a group column into a detail column
- Select the group column and right-click on it.
- Select Convert to Detail on the shortcut menu.
To convert a detail column into a group
- Select the detail column you want to convert and right-click on it.
- Select Convert to Group on the shortcut menu (Designer disables this menu command if you have used the field in the selected detail column as group-by field in the table).
- In the Select Group Position dialog box, specify the position for the newly converted group-by field.
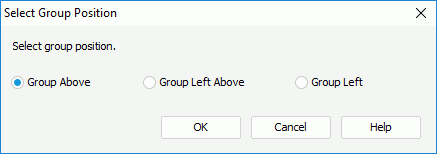
- Group Above
Select to add a new group header panel to hold the group-by field and remove the detail column. - Group Left Above
Select to convert the detail column to a group column and add a new group header panel to hold the group-by field. - Group Left
Select to convert the detail column to a group column and add the group-by field to the left of the detail field in the same column.
- Group Above
- Select OK to save the changes.
Aggregating on Detail Columns in a Table
You can calculate data based on any detail column in a table.
- Right-click the detail column and select Aggregate On from the shortcut menu. Designer displays the Aggregate On dialog box.
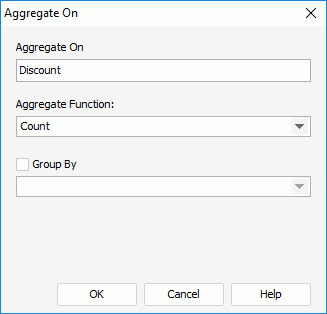
- From the Aggregate Function drop-down list, select the function to calculate the field in the detail column. If you select DistinctSum, you should select the ellipsis
 next to the Distinct On text box to specify one or more fields according to whose unique values to calculate DistinctSum using the Select Fields dialog box.
 - Specify the Group By option.
- If the table has groups and you want the summary to be applied on certain group level, select Group By and select the corresponding group-by field from the drop-down list below.
- If you want the summary to be applied on the whole dataset, select Group By and do not select any field from the drop-down list below.
- If you want to create a dynamic summary, keep Group By cleared. Designer then applies the summary on every group level and the whole dataset at the same time.
- Select OK. Designer then calculates data in the detail column based on the group-by setting using the specified function.
Then:
- For a table that uses a query resource in a page report, Designer creates a summary with the default name "Function_DetailFieldName" and saves it into the current catalog.
- For a table that uses a business view, Designer creates a dynamic aggregation with the default name "Function_DetailFieldName" in the current report.
Showing/Hiding Summaries in a Table
When creating or editing a summary table via the table wizard in a web report or library component, once you have added any summary on its table header/footer or group header/footer, after the table is generated, Designer activates the Show Summary Field command on the shortcut menu of all the summary columns in the table. You can use the menu command to show or hide the summaries in the headers/footers.
- Right-click the summary column that contains the required summary.
- From the Show Summary Field submenu, select/clear the corresponding table/group header/footer to show/hide the summary on the specified locations.
Designer places the summary in the intersection of its summary column and the table/group headers/footers.
Formatting Table Cells
- To merge cells in the group header/group footer/table footer, select adjacent cells, right-click and select Merge (or navigate to Home > Merge).
- To unmerge cells, right-click it and select Unmerge from the shortcut menu. Designer then splits the cell into multiple cells.
Unmerging is the reverse operation to merging, and therefore you can only unmerge previously merged cells.
- To format the border of a table cell, take the following steps:
- Right-click the cell and select Format Border from the shortcut menu. Designer displays the Format Cell dialog box.
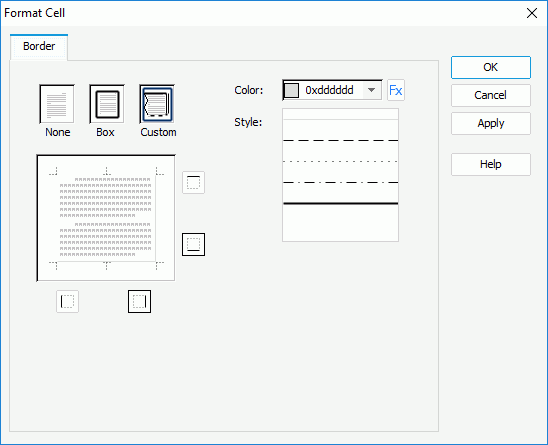
- Select in which manner to display the border for the tab cell:
- None
Select if you do not want to display border for the table cell. - Box
Select to insert a box border around the table cell. - Custom
Select to customize the border style by yourself. You can select a border icon: ,
,  ,
,  , or
, or  , to specify properties of the left, right, top, or bottom border respectively. When you select any of the border icons, Designer selects Custom automatically.
- None
- From the Color drop-down list, select the color to apply to the border, or select Custom to customize a color in the Pick a Color dialog box. If you want to use a formula to control the color, select
 and select a formula from the drop-down list.
 - In the Style list box, select the line style of the border.
- Select OK to accept the changes.
- Right-click the cell and select Format Border from the shortcut menu. Designer displays the Format Cell dialog box.
Resizing Table Columns/Rows
You can use the following methods to resize the columns/rows in a table.
- To resize a column, drag the boundary on the right side of the column to the required width. If the boundary is not the rightmost one, the column width changes, but the total width of the table does not change. If you want to change both the column width and the table width, select and hold Shift on the keyboard while dragging. To resize a row, drag the boundary below the row to the required height, then both the row height and the table height change. If you want to change just the row height, select and hold Shift on the keyboard while dragging the boundary.
- Select a table cell, change its Height or Width property in the Report Inspector, or right-click it, select Row Height or Column Width from the shortcut menu, then in the corresponding dialog box, type a value and select OK. Designer then changes the height/width of the row/column in which the cell is according to your specification.
- Select a column/row, right-click it and select Column Width/Row Height from the shortcut menu. In the Column Width/Row Height dialog box, type a value in the text box and select OK. Designer then changes the width/height of the column/row according to your specification. To resize a column, you can also change its Width property in the Report Inspector.
Showing, Hiding, and Deleting Table Columns/Rows
To specify which columns you want to show in a table
- Right-click the table and select Show Column from the shortcut menu. Designer displays the Show Column dialog box.
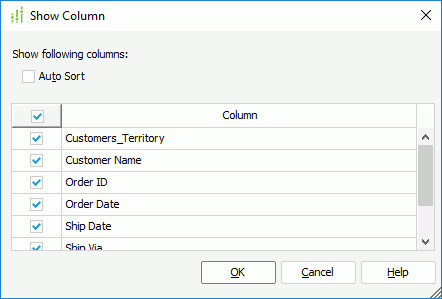
- The column box lists all the columns in the table, with text in cells of the table header panel representing corresponding columns. By default, Designer displays the columns according to their order in the table. Select Auto Sort if you want to list them alphabetically.
- Select the checkboxes ahead of the columns you want to show.
- Select OK to accept the changes.
To hide a table row
- Select the row and right-click on it.
- Select Hide from the shortcut menu.
To hide a table column
You can hide a table column using the following methods:
- Select the column, right-click it, and select Hide Column from the shortcut menu.
- Select the table, right-click it and select Show Column from the shortcut menu. In the Show Column dialog box, clear the column to be hidden.
- Select the cell in the table header, which is in the column you want to hide, right-click the cell and select Hide Column from the shortcut menu. If the table has more than one header panel, use the header in the first row to access the Hide Column command.
To delete a column/row
You can delete a table column/row using the following methods:
- Select the column/row, right-click it and select Delete from the shortcut menu.
- Select a cell which is in the column/row to be deleted, right-click it, and then select Delete from the shortcut menu. In the Delete dialog box, select Column or Row, select OK. Designer then deletes the column or row from the table.
![]() After a table is created, by default, its structure is fixed and you cannot delete any row from it. If you want to delete a row, you need to insert a same row first by using the shortcut menu, then you can delete the original row.
After a table is created, by default, its structure is fixed and you cannot delete any row from it. If you want to delete a row, you need to insert a same row first by using the shortcut menu, then you can delete the original row.
 Previous Topic
 Back to top