Previewing Reports
In the process of designing a report, you can preview it at any time. Designer supports previewing reports in Report format. For page reports and web reports, you can also preview them in formats such as HTML, PDF, and Excel. This topic describes how you can preview a report in different formats.
When previewing a report,
- If it contains parameters, Designer prompts you to specify values for the parameters.
- If you design it with National Language Support, you can specify the language to display the report by selecting the language from the Language drop-down menu in the Home or View ribbon.
- If it applies a style group, Designer prompts you to select the style group.
This topic contains the following sections:
Previewing a Report in Report Format
To preview a report in Report format, just select the View tab, which causes Report Engine to run the report (for more information about the options in the View tab, see Design/View Area). Designer then shows the result in the viewer. To optimize performance, Designer displays the report pages before Report Engine completely generates them.
You can use the following features when previewing different types of reports in Report format.
Previewing a Web Report
When previewing a web report in Report format, if you have set the Prefetch property of at least one business view the report uses to "true", Designer displays the View Result Without Prefetch checkbox at the top right corner of the Design/View area. By default, this option is cleared and the view result is that when "Prefetch=true" works. If you select this option and then select the View tab, you can preview the scheduled result of the report which ignores "Prefetch=true" and therefore may be different from the default view result.
Previewing a Library Component
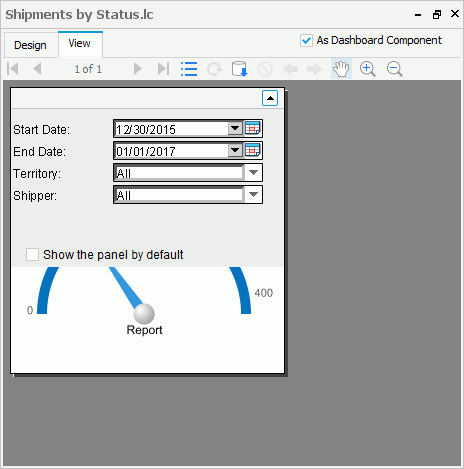
When previewing a library component in Report format, by default, Designer only displays the data components in the library component. You cannot preview the other parts like the configuration panel. If you want to preview the effect when the library component is published to Server and inserted into a dashboard, select As Dashboard Component at the top right corner of the View tab, then the title bar of the library component displays and you can select  on the title bar to open the configuration panel of the library component and preview the objects in it.
Previewing a 2-D Bar, Bench, Line, Area, or Stock Chart
When previewing a 2-D chart of the Bar, Bench, Line, Area, or Stock type in Report format, you can select the values you are interested in to zoom them.
- Drag the mouse from the start value to the end value you want to select.
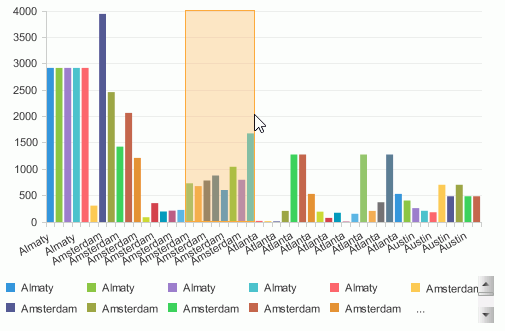
- Release the mouse. Designer zooms in the selected values. If you equip the chart with a scroll bar, Designer adjusts the bar automatically at the same time.
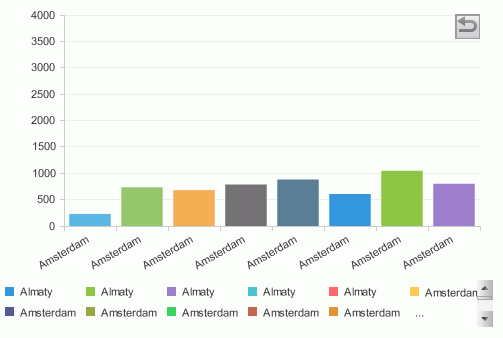
- To go back to the initial state of the chart, select the arrow at the upper right corner of the chart paper.
Previewing Banded Objects in a Page Report
When previewing a banded object in a page report in Report format, you can dynamically sort the records and go to the group details from aggregate level fields.
- Dynamic sort
You can sort the records in a banded object dynamically in the View tab. To do this, right-click any value of the field based on which to perform the sort and select Sort Ascending or Sort Descending from the shortcut menu. - Going to group details
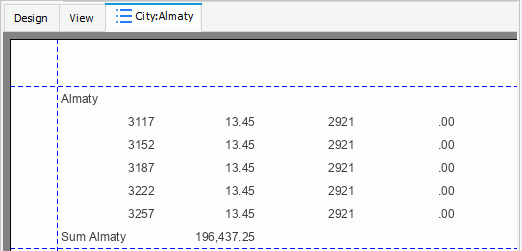
If a banded object uses a query resource and contains groups, you can go to the group details from aggregate level fields (summaries or group level formulas) in the group header/footer panels. For example, you have a banded object which is grouped by City and applies a summary on the group. When previewing the banded object, if you point to the total sales for a city, it turns into a small hand. Select the total and Designer displays the details of the selected city separately.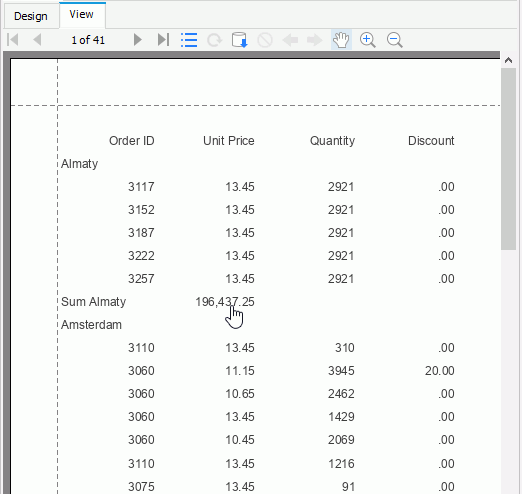
![]() After some modifications in the design area, if you find Designer displays the report very quickly and does not apply the changes in view mode, this means you need to select Refresh Data
After some modifications in the design area, if you find Designer displays the report very quickly and does not apply the changes in view mode, this means you need to select Refresh Data  on the toolbar to rerun your report.
Previewing a Report in Other Formats
You can also preview a page report or web report in the following formats: Page Report Result/Web Report Result, HTML, PDF, Excel, Text, RTF, XML, and PostScript. To do this, navigate to View > Preview As and then select a format from the drop-down menu. If you select Page Report Result/Web Report Result, Designer opens the report in Page Report Studio/Web Report Studio. When you select any of the other formats, Designer exports the report to a temporary file of the selected format which is then automatically opened by the appropriate application. Designer removes the temporary file when you exit it. If you want to save the file so you can review it at any time, use the Export feature instead.
The following are some tips for you when using the Preview As feature:
- The function of previewing a report in the Page Report Result/Web Report Result format is enabled only if you have selected the "Server for Previewing Reports" option when installing Designer.
- Previewing a web report in Web Report Result or a page report that uses business views in Page Report Result requires that you have a Live license for your Designer.
- The first time when you preview a report in Page Report Result/Web Report Result, the Preview Server that is included with Designer has to be started so it is slow. After the first time, the preview is much faster.
- The Preview Server is a web ad hoc disabled Server. It supports only one user and one report concurrently. Therefore, when you close the report you are previewing, you should use the Exit button of Web Report Studio/Page Report Studio instead of the browser's. In this way, you can release the user session you occupy at the same time, so that you are able to preview another report later.
- Designer and the Preview Server are running on two separated JVMs. The Preview Server applies the
-Djreport.url.encoding=UTF-8option in the startup file that works for URL encoding/decoding. Therefore, when you preview a report in the Page Report Result/Web Report Result format, if the name of the report or its report or catalog file contains non-Latin characters, you also need to add this JVM option to the startup batch file of Designer, JReport.bat in<install_root>\bin, if the batch file does not contain it; otherwise, the preview fails. - Make sure you have append the JDBC driver's class path to setenv.bat in
<install_root>\server\bin. - If your report contains user-defined objects (UDO), to have them work correctly on the Preview Server, you need to compile your Java files again using report.jar and JREngine.jar in the
<install_root>\server\libdirectory, modify udo.ini in<install_root>\server\lib, and append the classes to the class path of JRServer.bat in<install_root>\server\bin(make sure that the path of JREngine.jar is before that of report.jar). - When your report contains user-defined data sources (UDS) or user-defined formulas (UDF), you can use the classes you have compiled for using in Designer, but you need to append the classes to the class path of setenv.bat in
<install_root>\server\bin.
 Previous Topic
 Back to top